How to project newly promoted teams

One of the tricky things that I have come across over the years is how do you properly rate newly promoted teams coming up to the top division? For the Premier League, it’s been a rough go for the teams coming up from the Championship because the last two years all of the newly promoted teams have been relegated and it hasn’t been particularly close.
The problem that exists specifically for the Premier League is because teams like Bournemouth, Wolves, Brentford, Nottingham Forest, Fulham, etc. have now established themselves and are getting paid more and more each year they stay in the Premier League, it has made it very difficult for teams coming up to spend money and quickly to have a squad that is Premier League ready.
Because of that, you get big discrepancies in underlying data:
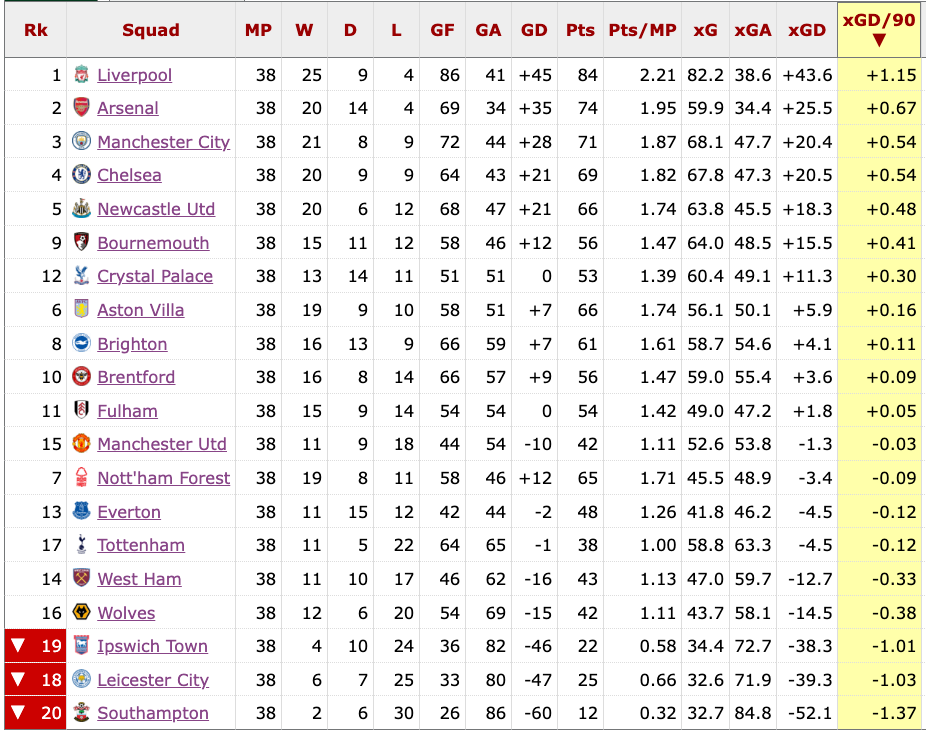
2024-25
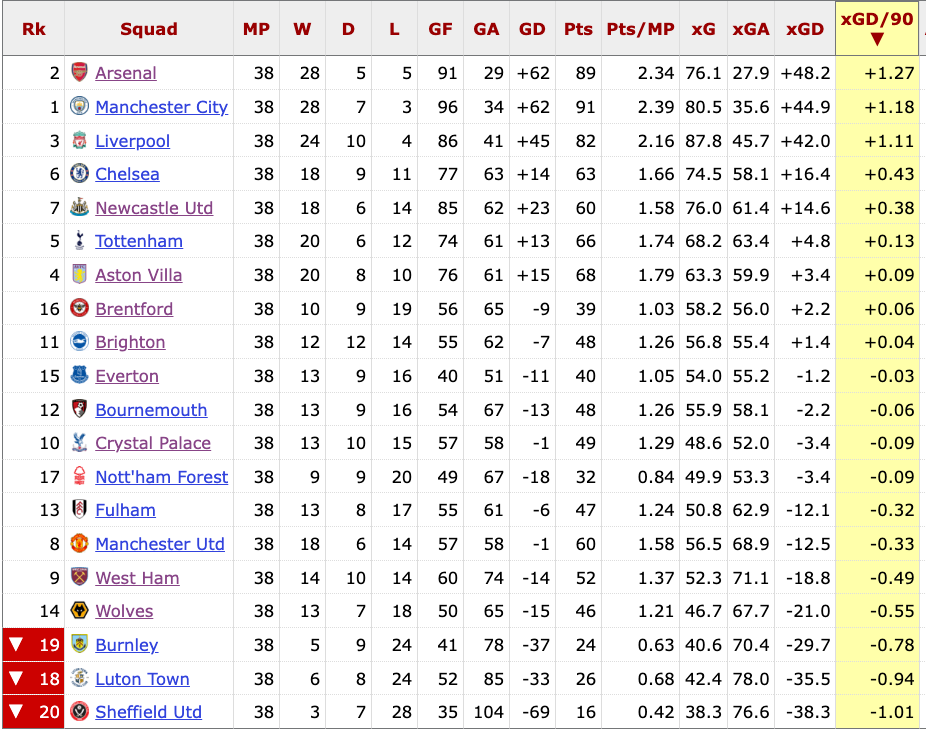
2023-24
Even when we look at the squad values at the end of last season, teams like Brentford, Brighton, Nottingham Forest, and Crystal Palace are now in the top 25 squad values world wide. That has made it even more difficult for newly promoted teams that yes, have an influx of cash, but have already spent big just to get out of the Championship.
For example, Leeds United during the 2023-24 & 2022-23 seasons reported an after tax loss of almost 100 million pounds. It’s very difficult for an owner to stomach continuing to spend more money on a squad to get it to the level of some of these teams like Fulham, Bournemouth, Crystal Palace, Everton, etc. that have already been spending for three to four years and have established squads.
You want to hear something pretty sickening? Ipswich Town spent 151 million on transfers during the last Premier League season and were still miles away from the rest of the Premier League.
I say all of this because I want you to keep everything in perspective as I go through how I project everything. It’s going to look pretty gloomy for two of the three newly promoted teams, but it’s reality of where we are right now in the Premier League.
How I project newly promoted teams
Yesterday I did a step by step guide on how I project individual football matches if you like to read it.
We are going to build on that foundation and take a look at projecting out newly promoted teams using Leeds, Burnley, and Sunderland as an example.
The barrier to entry in the Premier League is by far the most difficult of any of the top five leagues in Europe. Using expected goals from when they started widely being tracked during the 2017-18 season until now we can see that there is a massive difference between a team’s underlying data in the year of promotion and their first year in the Premier League.
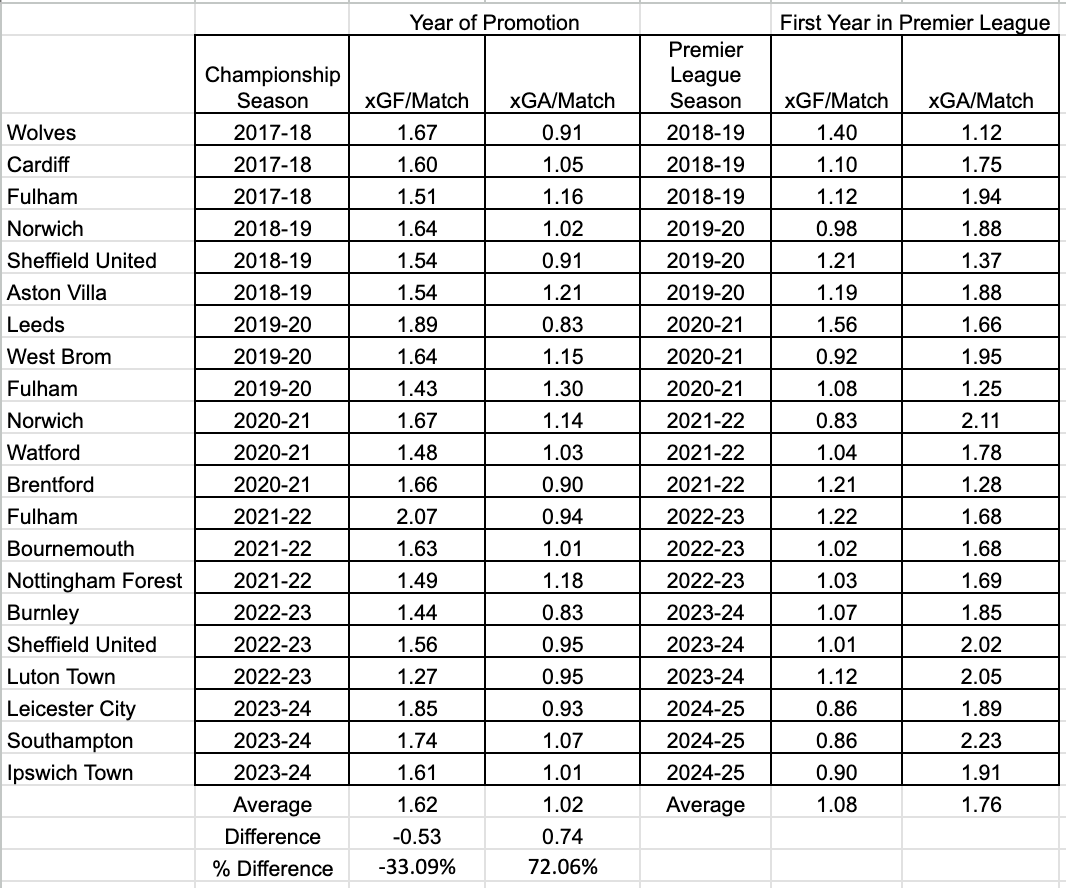
data via fbref.com
As you can see above, newly promoted teams see a 33.09% reduction in their expected goals for and a 72.06% in their expected goals allowed in their first season in the Premier League.
If you are using straight expected goals for your calculations, this is the formula you would use to get what the projection would be from that team in the Premier League.
Projected xGF = xGF from Promotion season + (xGF from Promotion season x -33.09%)
If we use Burnley as an example using their expected goals from the Championship:
xGF per 90 minutes: 1.25
xGA per 90 minutes: 0.85
This would be their projected xG in the Premier League.
xGF in Premier League = 1.25 + (1.25 x -33.09%) = 0.84
xGA in Premier League = 0.85 + (0.85 x 72.06%)= 1.46
My projections go a little deeper than just straight expected goals, so I need to figure out what each teams projected shots would be in the Premier League.
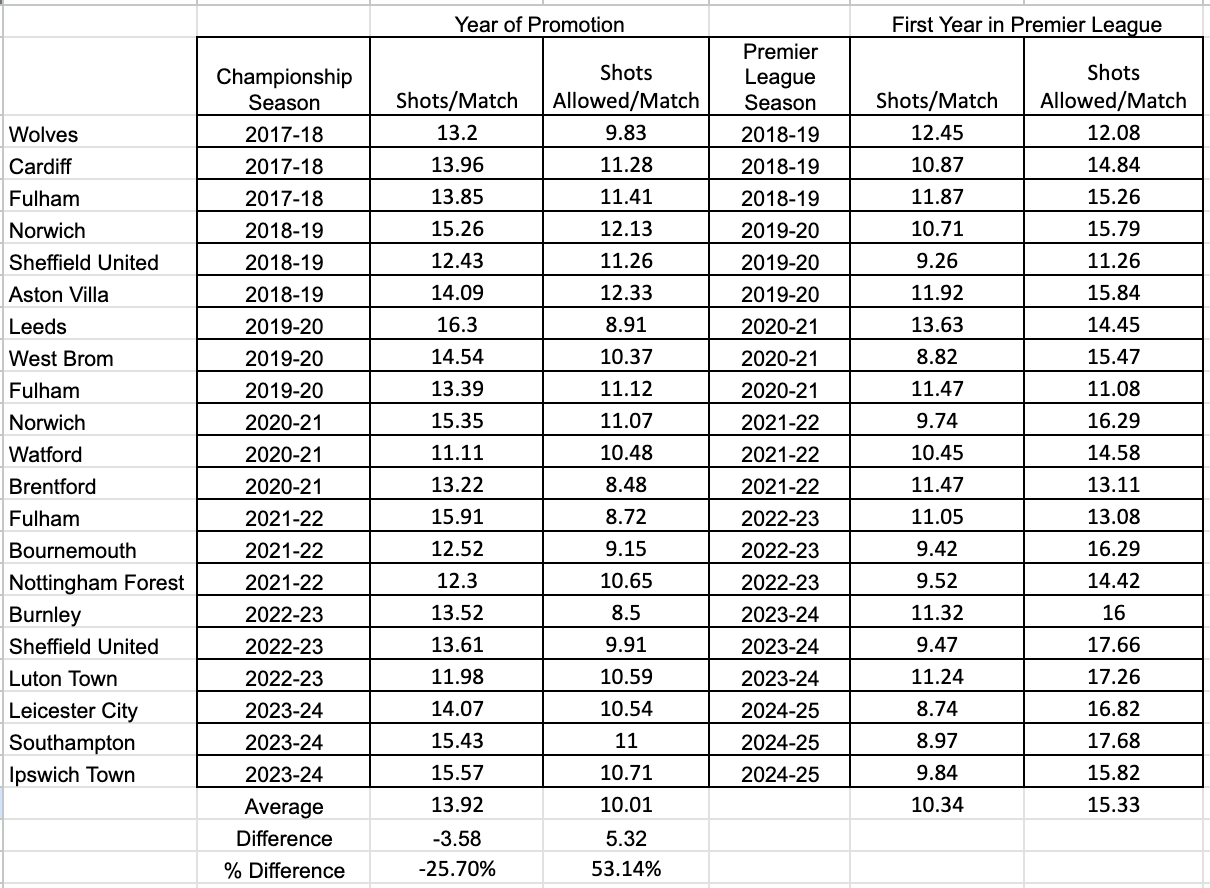
data via fbref.com
As you can see above, newly promoted teams see a 25.70% reduction in their shots for and a 53.14% in their shots allowed in their first season in the Premier League.
If we continue to use Burnley as an example using their shots allowed in the Championship:
Shots For per 90 minutes: 12.11
Shots Against per 90 minutes: 9.35
This would be their projected xG in the Premier League.
Shots For in Premier League = 12.11 + (12.11 x -25.70%) = 9.00
Shots Allowed in Premier League = 9.35 + (9.35 x 53.14%)= 14.32
From there we would take Burnley’s shot percentage by location from WhoScored.com times the number of shots per 90 minutes:
Burnley shots from outside box: 9.00 x 36% = 3.24
Burnley shots from inside the 18 yard box = 9.00 x 58% = 5.22
Burnley shots from inside the six yard box = 9.00 x 6% = 0.54
Next we calculate their xG by shot location. What I did here was some slight guessing, but it won’t make that big of a difference.
What I did was went through all of Burnley’s matches and added up their expected goals from inside the six yard box and then divided that by their total number shots from there to get their xG per shot from inside the six yard box.
Burnley xG from inside the six yard box: 13.58
Burnley xG per shot from inside the six yard box: 0.38
What meant by guessing is the average xG on a shot from outside the box is 0.035, so if we take that multiplied by Burnley’s total shots from outside the box we get: (201 shots x 0.035)= 7.04. We’re basically talking about maybe a half a percent difference, which isn’t going to matter in the ending calculation.
To get the total xG from inside the penalty area we would simply use the following formula:
Burnley Total xG - (Burnley xG from inside the six yard box + Burnley xG from outside the box) = Burnley xG from inside the 18 yard box
57.5 - (13.58 + 7.04) = 36.89
To get the xG per shot from inside the penalty area we take 36.89 xG / 320 shots = 0.12
Note: Penalties have been excluded from the calculation
Now I fully admit this next step is a little bit of estimation rather than exact science because I don’t have all of the historical xG by shot location from the Championship easily available (and I don’t want take the days it would take to calculate it).
If we take the 33.09% reduction in total xG and multiple that the percentage from each shot location we can get:
Inside the 18 yard box: 58% x -33.09% = -19.2%
Inside the six yard box: 6% x -33.09% = -1.99%
Outside the box: 36% x -33.09% = -11.91%
We take the percentages above and reduce each teams xG per shot by location:
Inside the 18 yard box: 0.12 + (0.12 x -19.19%) = 0.10
Inside the six yard box: 0.38 +(0.38 x -1.99%) = 0.37
Outside the box: 0.035 +(0.035 x -11.91%) = 0.03
Then the final step is to multiple the xG by shot location times the projected shots by location we calculated above (Penalties get accounted for at the end):
Inside the 18 yard box: 0.10 x 5.22 = 0.52
Inside the six yard box: 0.37 x 0.54 = 0.20
Outside the box: 0.03 x 3.24 = 0.10
Penalties: 0.76 x 0.03 = 0.02
Total xG = 0.84
We would then do the same calculation for Burnley’s xG against.
You can go and calculate Leeds and Sunderland’s on your own, but in the end this would be the projected xGF & xGA for the three newly promoted teams:
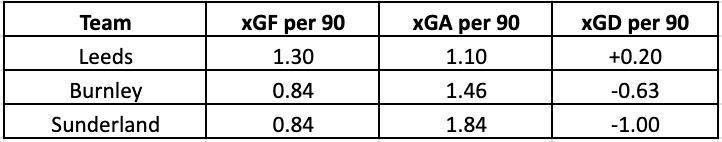
Fun Fact: Leeds United’s +1.30 xGD per 90 minutes last season was the best mark ever in the Championship since expected goals started widely being tracked during the 2017-18 season.
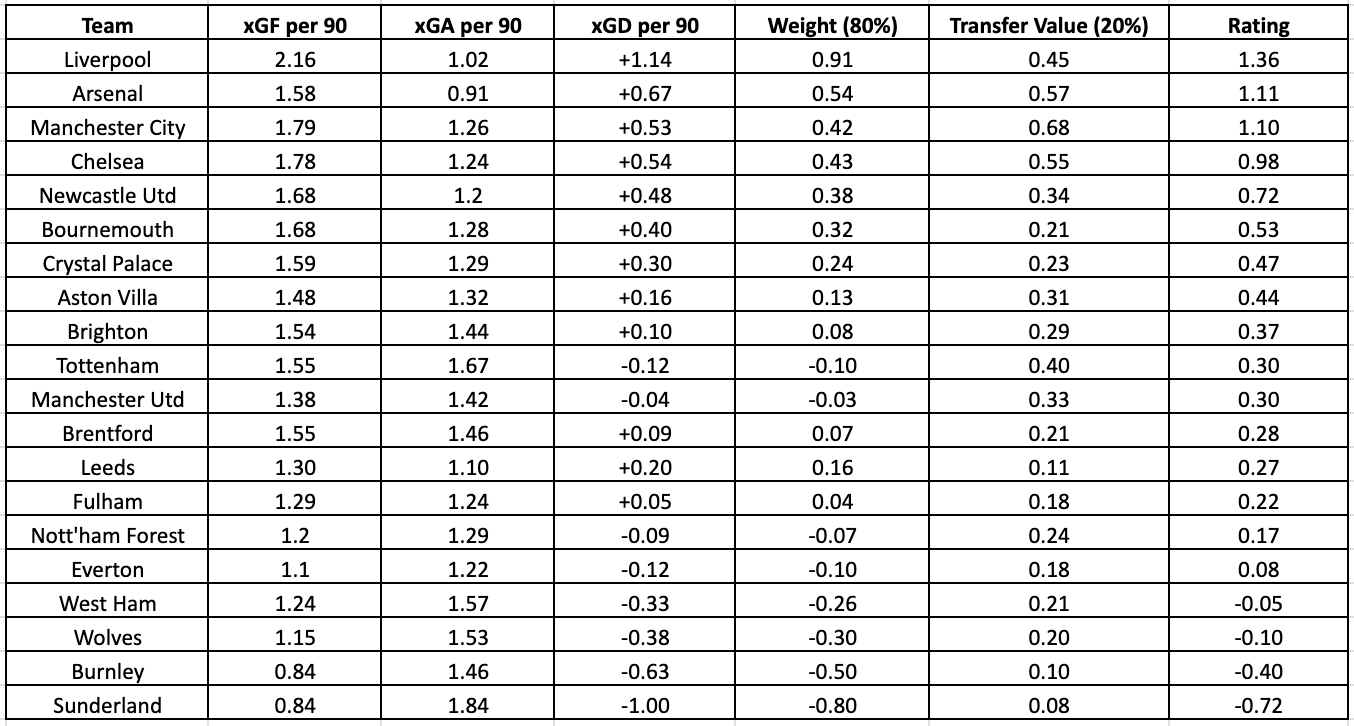
I still need to go through and make adjustments to each Premier League team but to figure out my Power Ratings it would be each team’s xGD weighted by 80% and then the remaining 20% is each teams talent level.
First we need to weight each team by their talent level. If you like to know how I did this you can read about it here.
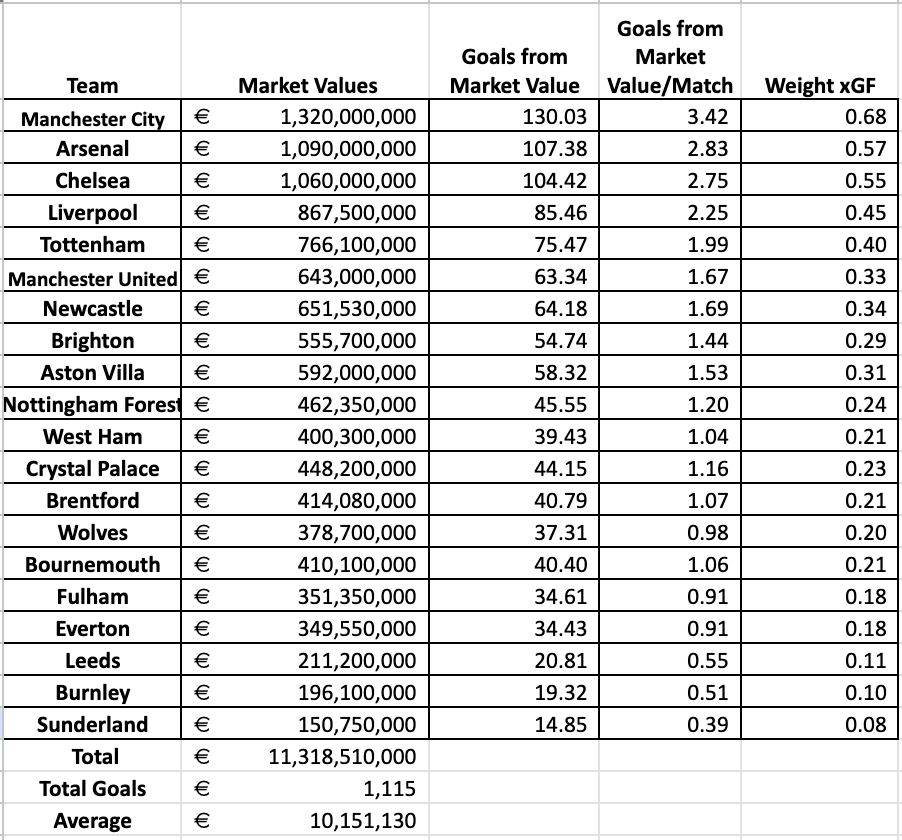
data via transfermarkt.com
Here is (roughly) where the newly promoted teams would be rated going into the new Premier League season.