


How I Simulated the FIFA Club World Cup

The more I research this tournament, the more I am willing to zig, while everyone else in the world zags: I think this tournament is going to be fun. I mean what has FIFA ever done that is so wrong?
What I thought I would do is explain how I even went about modeling and simulating this tournament. In a lot of ways it was similar to how I normally would project out matches in the Champions League with some different concepts.
Before I get started, this method is not perfect. If I had more time, access to better data, and was an experienced coder there would be things that I would have done differently. But, I can only use the data I have and the parameters of my limited brain.
What I have done with soccer though over the years is applied concepts that I have learned modeling baseball, college basketball, college football, etc. and applied it in a way that makes sense to me.
Simulations for the tournament & projections for every group stage are at the bottom, but they are only for paid subscribers
Individual Matches
1. Starting Data Point
First up we need to establish a data point for each club. Expected Goals is what I use and I want to use a large sample size. Sometimes matches that take place in all of the different Champions League competitions across the world can get a little misconstrued because the level of competition is so different. Instead I want a controlled environment that I can confidently say reflects each team (it will make more sense as you reach further). What I am using is each teams expected goals for and against per 90 minutes in their respective domestic leagues.

Data from fbref.com & footystats.org
This will be our starting point because like I said I want a big sample size rather than a few matches, even if it is against elite competition.
2. Strength of League
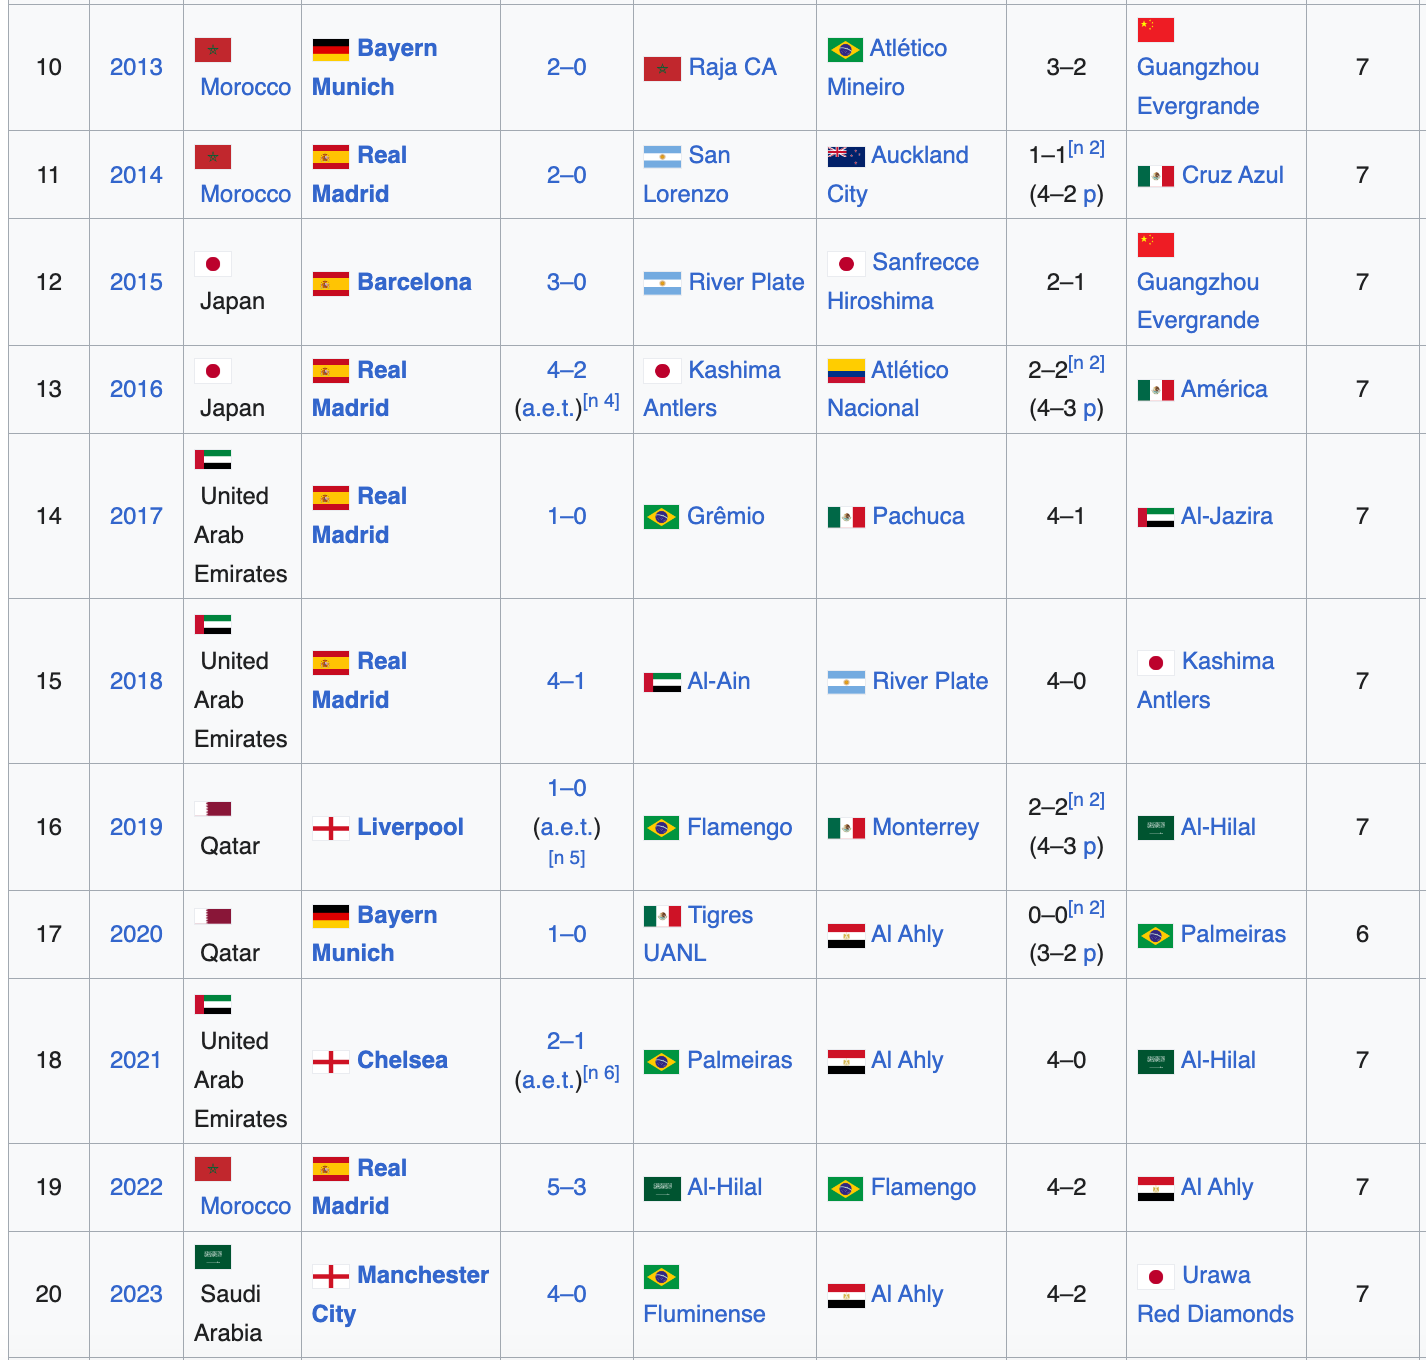
If I were modeling for the Champions League I would typically use a combination of UEFA coefficients and the league’s overall total market value from transfermarkt.com. I have created FIFA coefficients for my international soccer rankings, but it doesn’t make sense in a situation to create something similar because we’d have to use past results from the Club World Cup. The problem is a) this is the first time the FIFA Club World Cup is being played in this format and b) Europe has won every Club World Cup since 2013 and were automatically are put in the semifinals each year.
Like I said earlier, this method isn’t perfect and if I had the time, I may have been able to come up with a more detailed strength of schedule formula, but this method has been fairly accurate for me in the past with regards to the Champions League.
I use Michael Caley’s method of using a team's overall transfer value to account for the talent level of each country.
What we are trying to accomplish here is how much is one goal worth to each individual country. The 170 goals is the average from the last three International World Cups because I needed a baseline from a tournament with the exact same number of matches and teams.
Goals from Market Value = Country’s Market Value x Average per Goal
Goals from Market Value/Match = Goals from Market Value / 4.5 matches (this is the average amount matches for each team)
Weight xG = Goals from Market Value/Match x 10% (Not an exact science, just what I have found to be the most accurate over the past five years) *
* I made a manual adjustment to reduce England by 0.25 because (in my opinion) it was overweighting those teams in the projections and simulations.
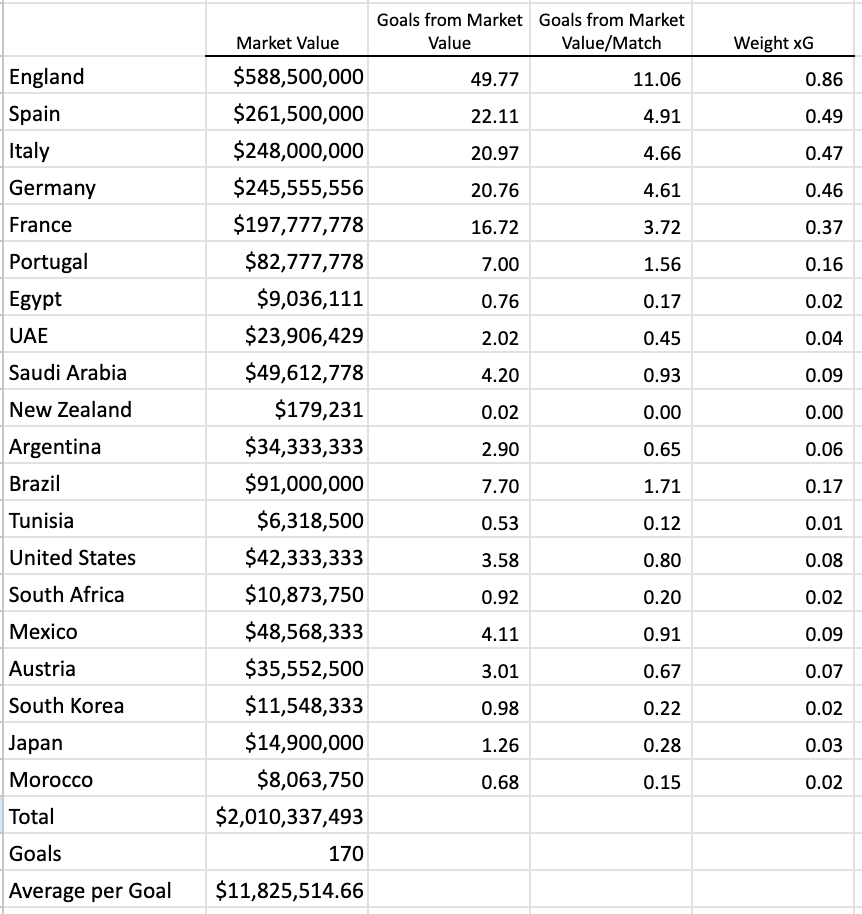
So, what we have now is essentially a strength of schedule rating compared to each country, which we will use in the projections.
3. Team Market Value
I have found from my years of modeling soccer matches that it is necessary to include a talent level adjustment. Sometimes, especially in the Premier League this year, talented teams can underperform.
I’ll put it to you this way: Do Fulham, Wolves, West Ham, and Crystal Palace have more talent than Tottenham because they finished higher in the table this season? You can believe whatever you want, but the answer is no.
So, I do the adjustment very similarly to how I adjusted teams for league strength. I take the total squad value of each team from transfermarkt.com and calculate the average market value per goal.
Goals from Market Value = Team’s Market Value x Average per Goal
Goals from Market Value/Match = Goals from Market Value / 4.5 matches (this is the average amount matches for each team)
Weight xG = Goals from Market Value/Match x 10% (Not an exact science, just what I have found to be the most accurate over the past five years)

4. Calculating each matchup
Now that we have are xG starting point, we have an adjustment to account for the strength of each league, and the talent level of each team it’s time to figure out the projected amount of goals for each team.
The basis of the formula I use is very similar concepts to what KenPom uses to calculate his projected final scores for College Basketball. For this example we will use PSG vs. Atletico Madrid.
For PSG:
Baseline xG calc = PSG xGF (2.61) x Atletico Madrid xGA (0.88) / Tournament Average (1.39) = 1.65
League Strength = (France (0.37) - Spain (0.49))/2 = -0.06
Note: The reason it’s divided by two (same applies to the market value) is because I am going to apply the same formula to Atletico Madrid. I do this so it doesn’t effect the total amount of goals projected.
Market Value = (PSG (0.77) - Atletico Madrid (0.38))/2 = 0.195
PSG Projected Goals 1.65 (Baseline) + -0.06 (League Strength) + 0.195 (Market Value) = 1.79
For Atletico Madrid:
Baseline xG calc = Atletico Madrid xGF (1.7) x PSG xGA (0.92) / Tournament Average (1.39) = 1.12
League Strength = (Spain (0.49) - Spain (0.37))/2 = +0.06
Market Value = (Atletico Madrid (0.38) - PSG (0.77))/2 = -0.195
Atletico Madrid Projected Goals 1.12 (Baseline) + 0.06 (League Strength) + -0.195 (Market Value) = 0.99
From there the best method to use for predicting the outcome of the match now that we have our projected goals for each team is Poisson Distribution.
The reason we use Poisson Distribution it is suitable for modeling the probability of independent events occurring over a fixed period, which is relevant to goals scored during a match. What it does is gives the probability of every possible scoreline for the match.
If you’d like to truly nerd out, Dixon-Coles were the first ones to develop a prediction model for soccer using poisson distribution and can explain it better than I can.
The formula we use for Poisson Distribution in Google Sheets or Excel is actually quite simple: =((POISSON(Exact Goals Amount,(PSG Projected Goals),FALSE))*(POISSON(Exact Goals Amount,(Atletico Madrid Projected Goals), FALSE)))
Here is what the formula would look like if I wanted to know what the likelihood of the final scored PSG 2 - Atletico Madrid 1 would look like:
((POISSON(2,(1.79),FALSE)*(POISSON(1,(0.99),FALSE))) = 9.84%
What do then is set everything up in a matrix form like the one below and simply link the exact goal number to each formula and then use $ as an absolute cell reference for both PSG and Atletico Madrid’s goals, meaning when I drag the formula the projected goal amounts will stay the same.
In the end it looks something like this:
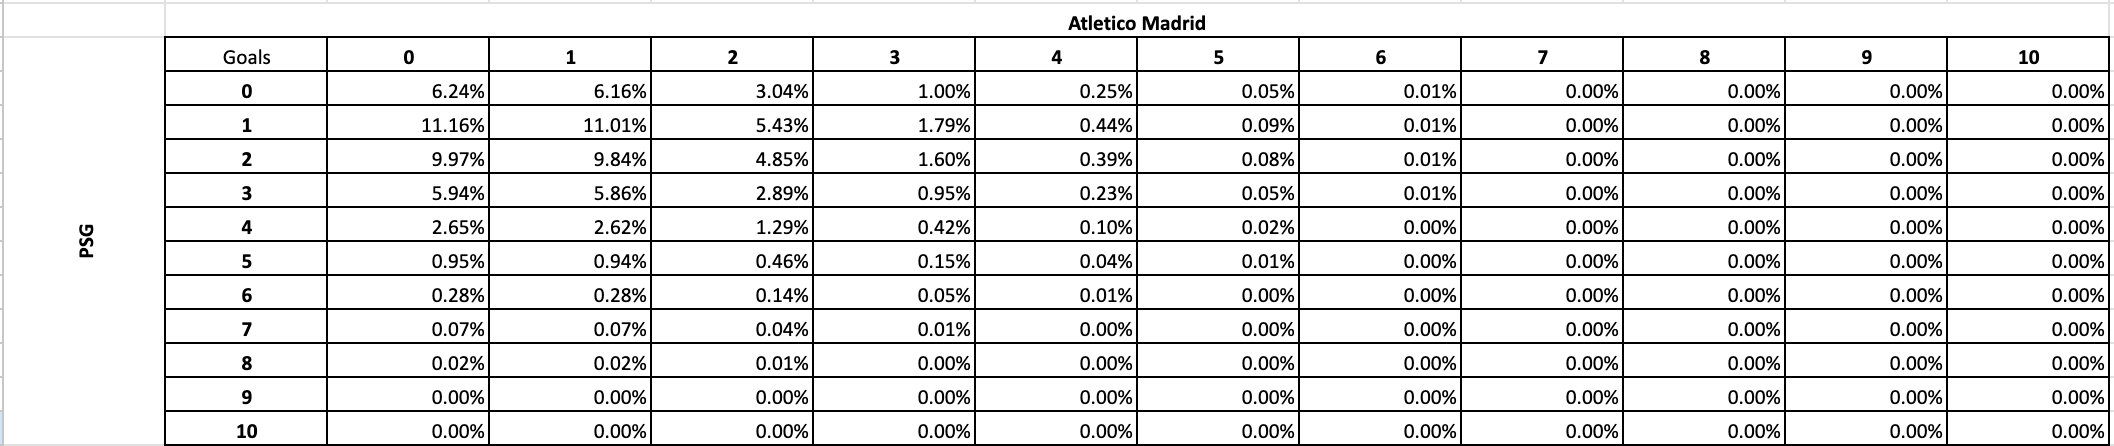
If add every possible outcome up I get:
PSG Win = 56.17%
Draw = 23.17%
Atletico Madrid Win = 20.66%
Group Simulations
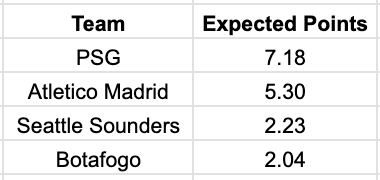
Using the PSG vs. Atletico Madrid example, I would then use the expected points formula (Win x 3) + (Draw x 1) for every match in each group to calculate the number of expected points for the group.
Using Group B as the example, after I calculated every match in the group using the methodology explained above and applying expected points to the win and draw probabilities for each team, here are my final expected points:
From here I run a Monte Carlo Simulation 10,000 times with a Standard Deviation of 2. What a Monte Carlo Simulation does is randomly predict the possible outcomes of an uncertain event by simulating a range of future scenarios based on random inputs.
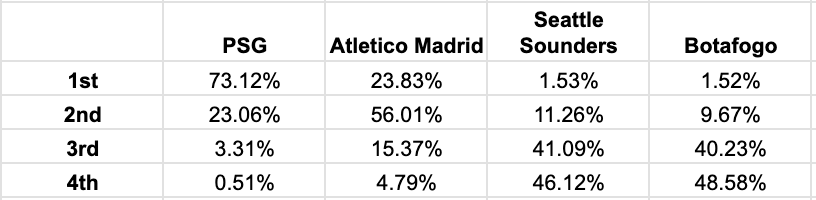
After I run the simulations for every possibility, here are the outcomes:
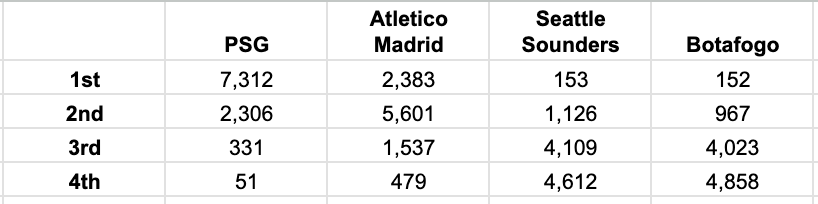
To get these into percentage format I would simply have to divide them 10,000
Knockout Stage
This is where things get really boring and to be honest there is really not a whole lot to it other than a lot IF formulas using the probability of each team advancing in each matchup and the probability that they will face that team at each knockout stage.
I’ll use PSG as an example for their probability of making it to the quarterfinals:
Here we are using the percentage chance of PSG finishing 1st and 2nd in the group multiplied by Group A teams percentage of finishing 1st and 2nd in their respective group since 1st Place in Group A faces 2nd Place in Group B & 1st Place in Group B faces 2nd Place in Group A in the knockout stage.
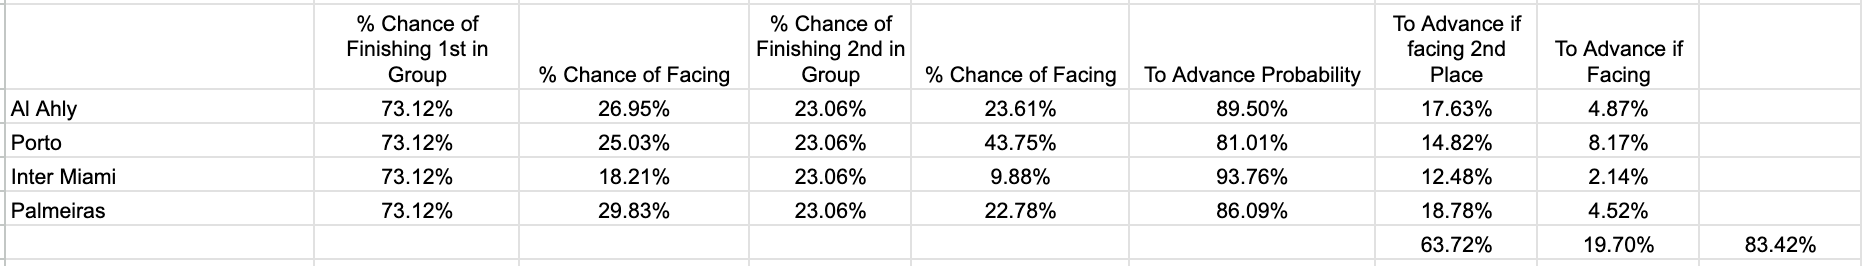
From there I do similar calculations for each step of the tournament to get the percentage chance for each getting to the individual stages.
Keep reading with a 7-day free trial
Subscribe to Unexpected Goals to keep reading this post and get 7 days of free access to the full post archives.